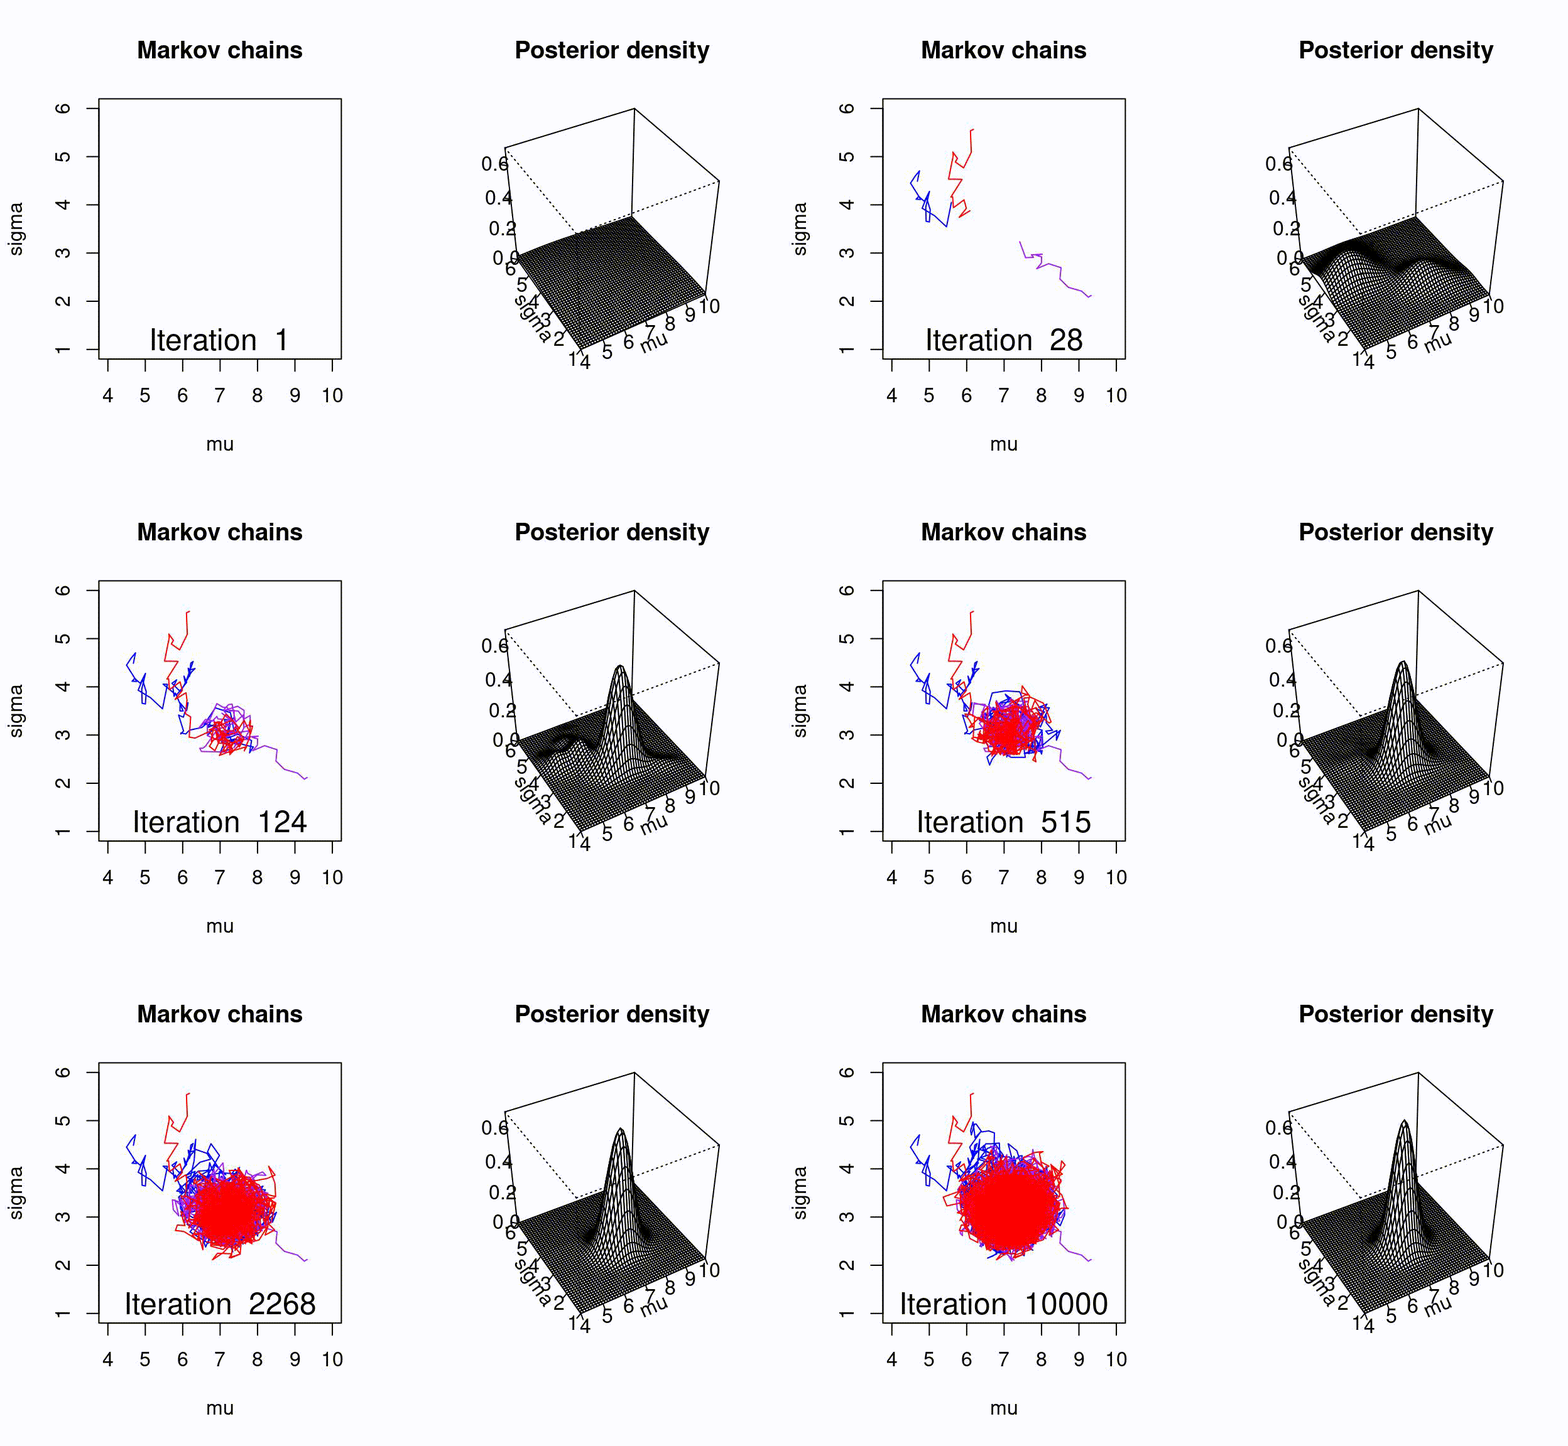
The Metropolis algorithm, and its generalization (Metropolis-Hastings algorithm) provide elegant methods for obtaining sequences of random samples from complex probability distributions (Beichl and Sullivan 2000). When I first read about modern MCMC methods, I had trouble visualizing the convergence of Markov chains in higher dimensional cases. So, I thought I might put together a visualization in a two-dimensional case.
I’ll use a simple example: estimating a population mean and standard deviation. We’ll define some population level parameters, collect some data, then use the Metropolis algorithm to simulate the joint posterior of the mean and standard deviation.
library(sm)

# population level parameters
mu <- 7
sigma <- 3

# collect some data (e.g. a sample of heights)
n <- 50
x <- rnorm(n, mu, sigma)

# log-likelihood function
ll <- function(x, muhat, sigmahat){
  sum(dnorm(x, muhat, sigmahat, log=T))
}

# prior densities
pmu <- function(mu){
  dnorm(mu, 0, 100, log=T)
}

psigma <- function(sigma){
  dunif(sigma, 0, 10, log=T)
}

# posterior density function (log scale)
post <- function(x, mu, sigma){
  ll(x, mu, sigma) + pmu(mu) + psigma(sigma)
}

geninits <- function(){
  list(mu = runif(1, 4, 10),
       sigma = runif(1, 2, 6))
}

jump <- function(x, dist = .2){ # must be symmetric
  x + rnorm(1, 0, dist)
}

iter = 10000
chains <- 3
posterior <- array(dim = c(chains, 2, iter))
accepted <- array(dim=c(chains, iter - 1))

set.seed(1234)
for (c in 1:chains){
  theta.post <- array(dim=c(2, iter))
  inits <- geninits()
  theta.post[1, 1] <- inits$mu
  theta.post[2, 1] <- inits$sigma
  for (t in 2:iter){
    # theta_star = proposed next values for parameters
    theta_star <- c(jump(theta.post[1, t-1]), jump(theta.post[2, t-1]))
    pstar <- post(x, mu = theta_star[1], sigma = theta_star[2])
    pprev <- post(x, mu = theta.post[1, t-1], sigma = theta.post[2, t-1])
    lr <- pstar - pprev
    r <- exp(lr)

    # theta_star is accepted if posterior density is higher w/ theta_star
    # if posterior density is not higher, it is accepted with probability r
    # else theta does not change from time t-1 to t
    accept <- rbinom(1, 1, prob = min(r, 1))
    accepted[c, t - 1] <- accept
    if (accept == 1){
      theta.post[, t] <- theta_star
    } else {
      theta.post[, t] <- theta.post[, t-1]
    }
  }
  posterior[c, , ] <- theta.post
}
Then, to visualize the evolution of the Markov chains, we can make plots of the
chains in 2-parameter space, along with the posterior density at different
iterations, joining these plots together using ImageMagick’s convert command
(in the terminal) to create an animated .gif:
sequence <- unique(round(exp(seq(0, log(iter), length.out = 150))))

xlims <- c(4, 10)
ylims <- c(1, 6)

for (i in sequence){
  par(mfrow=c(1, 2))
  plot(posterior[1, 1, 1:i], posterior[1, 2, 1:i],
       type="l", xlim=xlims, ylim=ylims, col="blue",
       xlab="mu", ylab="sigma", main="Markov chains")
  lines(posterior[2, 1, 1:i], posterior[2, 2, 1:i],
        col="purple")
  lines(posterior[3, 1, 1:i], posterior[3, 2, 1:i],
        col="red")
  text(x=7, y=1.2, paste("Iteration ", i), cex=1.5)
  sm.density(x=cbind(c(posterior[, 1, 1:i]), c(posterior[, 2, 1:i])),
             xlab="mu", ylab="sigma",
             zlab="", zlim=c(0, .7),
             xlim=xlims, ylim=ylims, col="white",
             verbose=0)
  title("Posterior density")
}