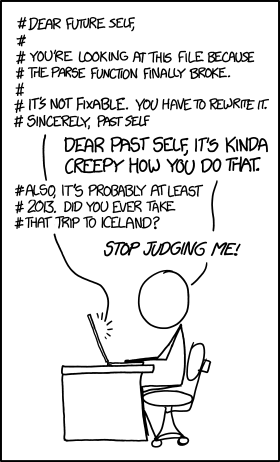
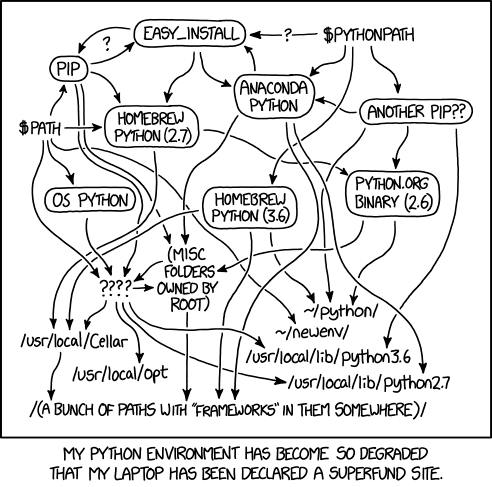
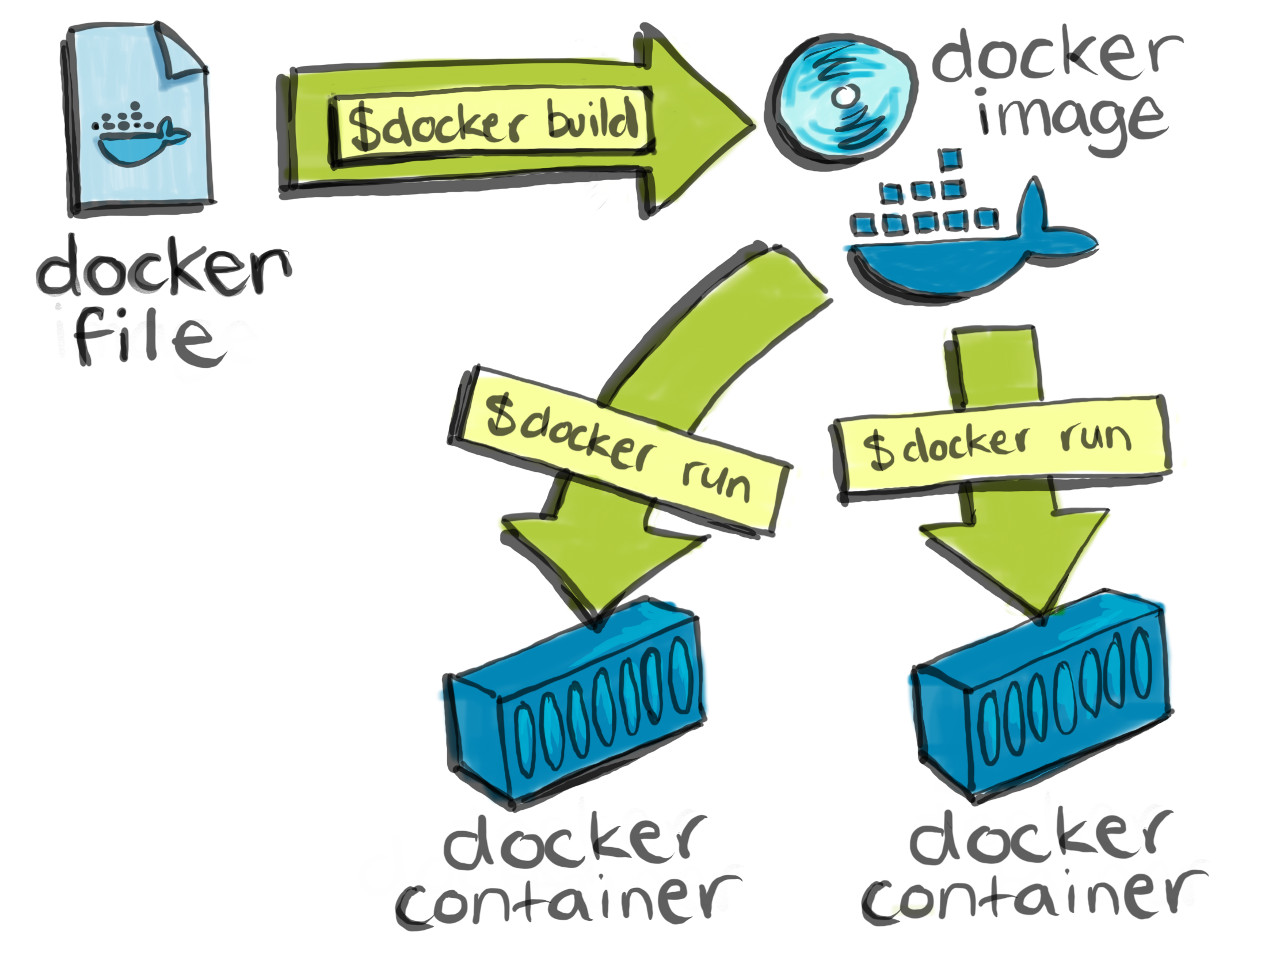
class: top, center, title-slide # HOW (AND WHY) TO MAKE A RESEARCH COMPENDIUM ## Dr. Max Joseph<a href="https://orcid.org/0000-0002-7745-9990"><img src="https://orcid.org/sites/default/files/images/orcid_32x32.png" /></a> ### <span class="citation">@mxwlj</span> (Twitter), <span class="citation">@mbjoseph</span> (GitHub) ### Earth Lab ### 2020-03-19 --- background-image: url(https://www.earthdatascience.org/images/earth-lab-logo.png) background-position: top right background-size: 110px 60px layout: true --- ## COMPENDIUM = ## DATA + CODE + TEXT .center[] .footnote[Image credit: [The Turing Way](https://github.com/alan-turing-institute/the-turing-way/raw/eda2fbba5bcb7c654ed32a0d8d13ab87d5fb6d7c/book/content/figures/ResearchCompendium.jpg)] --- ## WHY MAKE A RESEARCH COMPENDIUM? - make it easy (for you or others) to reproduce .center[] .footnote[Image credit: [xkcd](https://xkcd.com/1421/)] --- ## WHY MAKE A RESEARCH COMPENDIUM? - make it easy to reproduce - make your work: - **transparent** - **reliable** - **reusable** - **visible** --- ## ORGANIZATION - use a **conventional directory structure** - **separate** data, methods, and output - specify the computational **environment** .footnote[ Marwick, Ben, Carl Boettiger, and Lincoln Mullen. "Packaging data analytical work reproducibly using R (and friends)." The American Statistician 72.1 (2018): 80-88. ] --- ## BASIC EXAMPLE ``` compendium/ ├── data │ ├── my_data.csv ├── analysis │ └── my_script.R └── README.md ``` ✅ directory structure --- ## BASIC EXAMPLE ``` compendium/ ├── data │ ├── my_data.csv ├── analysis │ └── my_script.R └── README.md ``` ✅ directory structure ✅ separate components --- ## BASIC EXAMPLE ``` compendium/ ├── data │ ├── my_data.csv ├── analysis │ └── my_script.R └── README.md ``` ✅ directory structure ✅ separate components ✅ environment specified (in README) --- ## COMPONENTS - set rules for re-use - separate input and output - specify a computational environment - coordinate multiple steps - generate a paper or report - add automated tests* - add interactivity* .footnote[ \* things we won't cover today ] --- ## RULES FOR RE-USE Choose a LICENSE! https://choosealicense.com/ --- ## THE REPRODUCIBLE RESEARCH STANDARD Recommendations: - CC-BY for media (text, figures) - MIT for code - CC0 data (public domain) .footnote[ Stodden, Victoria. "Enabling reproducible research: Open licensing for scientific innovation." International Journal of Communications Law and Policy, Forthcoming (2009). ] --- ## ADDING A LICENSE ``` compendium/ ├── data │ ├── my_data.csv ├── analysis │ └── my_script.R ├── LICENSE └── README.md ``` --- ## COMPONENTS - set rules for re-use ✅ - separate input and output - specify a computational environment - coordinate multiple steps - generate a paper or report --- ## RAW VS. COOKED ``` compendium/ ├── data │ └── raw/ │ └── my_data.csv │ └── clean/ │ └── data_clean.csv ├── analysis │ └── my_script.R ├── LICENSE └── README.md ``` --- ## TRACKING FIGURES ``` compendium/ ├── data │ └── raw/ │ └── my_data.csv │ └── clean/ │ └── data_clean.csv ├── analysis │ └── my_script.R ├── figures │ └── awesome_plot.png ├── LICENSE └── README.md ``` --- ## ASIDE: GIT PROTIP Do not track generated outputs ``` compendium/ ├── data │ └── raw/ │ └── my_data.csv │ └── clean/ │ └── data_clean.csv ├── analysis │ └── my_script.R ├── figures │ └── awesome_plot.png ├── LICENSE └── README.md ``` --- ## GIT IGNORING FILES Use a `.gitignore` file: ```bash data/clean/ figures/*.png ``` --- ## .gitignore ``` compendium/ ├── .gitignore ├── data │ └── raw/ │ └── my_data.csv │ └── clean/ │ └── data_clean.csv ├── analysis │ └── my_script.R ├── figures │ └── awesome_plot.png ├── LICENSE └── README.md ``` --- ## COMPONENTS - set rules for re-use ✅ - separate input and output ✅ - specify a computational environment - coordinate multiple steps - generate a paper or report --- .center[] .footnote[Image credit: [xkcd](https://xkcd.com/1987/)] --- ## ENVIRONMENT SPECIFICATION **Python** - `requirements.txt` - `environment.yml` - `setup.py` - `Pipfile` **R** - `DESCRIPTION` --- ## environment.yml ```bash name: denvertraffic dependencies: - pandas - matplotlib - python=3.8 ``` --- ## SHOUTOUT: DOCKER Make an executable environment! .center[] .footnote[ Image © Copyright Cultivate Software Ltd https://cultivatehq.com/posts/docker/ ] --- ## UPDATED COMPENDIUM ``` compendium/ ├── .gitignore ├── data │ └── raw/ │ └── my_data.csv │ └── clean/ │ └── data_clean.csv ├── analysis │ └── my_script.R ├── figures │ └── awesome_plot.png ├── LICENSE ├── environment.yml └── README.md ``` --- ## COMPONENTS - set rules for re-use ✅ - separate input and output ✅ - specify a computational environment ✅ - coordinate multiple steps - generate a paper or report --- ## MULTIPLE STEPS ``` compendium/ ├── .gitignore ├── data │ └── raw/ │ └── my_data.csv │ └── clean/ │ └── data_clean.csv ├── analysis | ├── 03-eda.py | ├── 02-clean_data.py │ └── 01-get_data.py ├── figures │ └── awesome_plot.png ├── LICENSE ├── environment.yml └── README.md ``` --- ## A MULTISTEP WORKFLOW .center[] --- ## EFFICIENT COMPUTATION .center[] `02-clean_data.py` is updated --- ## TOOLS FOR MULTISTEP WORKFLOWS Simple - `main.py` - `main.sh` Fancy - [GNU Make](https://www.gnu.org/software/make/) - [snakemake](https://snakemake.readthedocs.io/en/stable/) (Python) - [drake](https://github.com/ropensci/drake) (R) --- ## GNU MAKE A `Makefile` specifies 1. relationships among files 2. how to generate output --- .center[] ```bash # target: prerequisites # recipe ``` --- .center[] ```bash # target: prerequisites # recipe data.csv: 01-get_data.py python 01-get_data.py ``` --- .center[] ```bash # target: prerequisites # recipe data.csv: 01-get_data.py python 01-get_data.py clean_data.csv: data.csv 02-clean_data.py python 02-clean_data.py ``` --- .center[] ```bash # target: prerequisites # recipe data.csv: 01-get_data.py python 01-get_data.py clean_data.csv: data.csv 02-clean_data.py python 02-clean_data.py awesome_plot.png: clean_data.csv 03-eda.py python 03-eda.py ``` --- ## Updated compendium ``` compendium/ ├── .gitignore ├── data │ └── raw/ │ └── my_data.csv │ └── clean/ │ └── data_clean.csv ├── analysis | ├── 03-eda.py | ├── 02-clean_data.py │ └── 01-get_data.py ├── figures │ └── awesome_plot.png ├── LICENSE ├── environment.yml ├── Makefile └── README.md ``` --- ## COMPONENTS - set rules for re-use ✅ - separate input and output ✅ - specify a computational environment ✅ - coordinate multiple steps ✅ - generate a paper or report --- ## GENERATING PAPERS [pandoc](https://pandoc.org/) - markdown `\(\rightarrow\)` pdf, docx, html [R Markdown](https://rmarkdown.rstudio.com/) - R Markdown `\(\rightarrow\)` pdf, docx, html [nbconvert](https://nbconvert.readthedocs.io/en/latest/) - Jupyter notebook `\(\rightarrow\)` pdf, html --- ## Our updated compendium ``` compendium/ ├── .gitignore ├── data │ └── raw/ │ └── my_data.csv │ └── clean/ │ └── data_clean.csv ├── analysis | ├── 03-eda.py | ├── 02-clean_data.py │ └── 01-get_data.py ├── figures │ └── awesome_plot.png ├── LICENSE ├── environment.yml ├── Makefile ├── README.md └── paper.md ``` --- ## COMPONENTS - set rules for re-use ✅ - separate input and output ✅ - specify a computational environment ✅ - coordinate multiple steps ✅ - generate a paper or report ✅ --- ## SEE IT IN ACTION GitHub: [mbjoseph/intro-research-compendia](https://github.com/mbjoseph/intro-research-compendia) --- ## RESOURCES - [rOpenSci reprodibility guide](https://ropensci.github.io/reproducibility-guide/sections/introduction/) - [The Turing Way](https://the-turing-way.netlify.com/introduction/introduction) - [Browse examples on GitHub](https://github.com/topics/research-compendium/) - [Research Compendium landing page](https://research-compendium.science/) --- class: center, middle # Thanks! Slides created via the R package [**xaringan**](https://github.com/yihui/xaringan). The chakra comes from [remark.js](https://remarkjs.com), [**knitr**](http://yihui.org/knitr), and [R Markdown](https://rmarkdown.rstudio.com). Work funded by the NSF HDR program.