This is an example of interfacing R, shiny, and deSolve to produce an interactive environment where users can explore model behavior by altering parameters in an easy to use GUI.
The model tracks the number of susceptible, infectious, and recovered individuals in two co-occuring host species. The rates of change for each class are represented as a system of differential equations:
\[\dot{S_1} = (b_1 - \Delta_1N_1)N_1 - d_1S_1 - S_1 (\beta_{11} I_1 + \beta_{12} I_2)\]
\[\dot{I_1} = S_1 (\beta_{11} I_1 + \beta_{12} I_2) - (d_1 + \alpha_1 + \sigma_1)I_1\]
\[\dot{R_1} = \sigma_1 I_1 - d_1R_1\]
\[\dot{S_2} = (b_2 - \Delta_2N_2)N_2 - d_2S_2 - S_2 (\beta_{22} I_2 + \beta_{21} I_1)\]
\[\dot{I_2} = S_2 (\beta_{22} I_2 + \beta_{21} I_1) - (d_2 + \alpha_2 + \sigma_2)I_2\]
\[\dot{R_2} = \sigma_2 I_2 - d_2R_2\]
Where \(S_i\), \(I_i\), and \(R_i\) represent the density of susceptible, infectious, and recovered individuals respectively of species \(i\). The total number of individuals of each species is \(N_i\). Per capita birth and death rates are represented by \(b_i\) and \(d_i\), and the strength of density dependence in population growth is \(\delta_i\). Transmission rates from species \(j\) to species \(i\) are given by \(\beta_{ij}\). The pathogen imposes additional mortality for infected individuals at rate \(\alpha_{i}\), and infected individuals recover at rate \(\sigma_{i}\) so that the average infectious period is \(\frac{1}{\sigma_{i}}\). Here, it is assumed that the pathogen does not castrate its hosts. Thus, susceptible, infectious, and recovered individuals reproduce at the same rate.
Epidemiological models often differentiate between two transmission dynamics. With density-dependent transmission, the number of host contacts and transmission events increases with the density of individuals (as shown in the above system of equations). In contrast, with frequency-dependent transmission, hosts have a constant contact rate so that the transmission rate depends on the relative proportion of infectious individuals. As an example, models of sexually transmitted infections often assume frequency dependent transmission, implying that the number of sexual partners one has is independent of population density. To incorporate frequency dependent transmission into the above model, it is necessary to divide the transmission term \(S\sum{(\beta I)}\) by \(N\).
Based on this system of equations, a criterion for pathogen invasion called \(R_0\) can be derived based on the dominant eigenvalue of the next generation matrix (Dobson 2004). If \(R_0 < 1\), the pathogen does not invade; if \(R_0>1\), the pathogen invades.
Building the R shiny app
Shiny requires two files to run: a file containing all of the calculations, plotting functionality, etc., and a file defining a user interface.
Here is the file defining what you want the server to do. Note the use of ifelse() to have either density- or frequency-dependent transmission.
Here is the file defining the user interface.
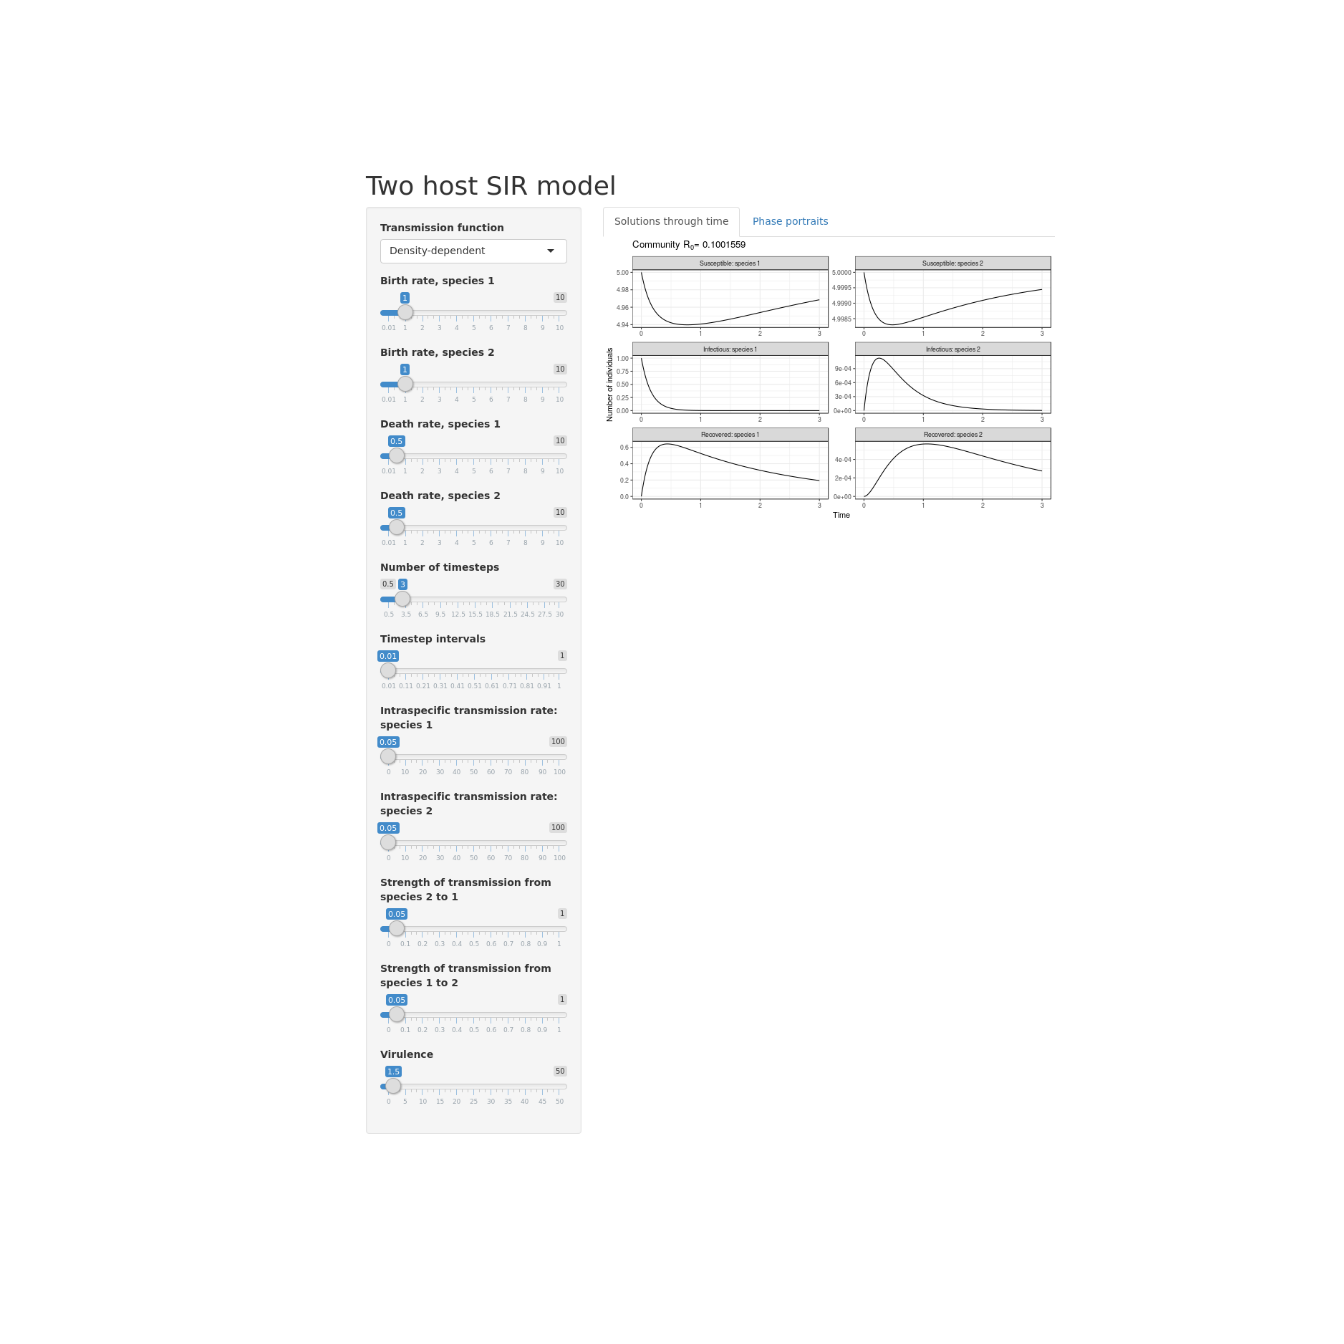
Here is a link to the resulting app.
library(imager)
im <- load.image("https://raw.githubusercontent.com/mbjoseph/2hostSIR/master/tests/test-expected/001.png")
plot(im, axes = FALSE)