How does habitat diversity affect species richness? Perhaps intuition suggests that habitat diversity increases species richness by facilitating niche or resource partitioning among species. But, for a fixed area, as habitat heterogeneity increases, the area that can be allocated to each habitat type decreases. A recent paper provides a theoretical and empirical treatment of the habitat area-heterogeneity trade-off’s consequences for species richness (Allouche et al. 2012). Both treatments of the subject indicated that the relationship between habitat heterogeneity and species richness may be unimodal, rather than strictly increasing.
Conceptually, this is expected to occur when on the left side of the curve, increasing habitat heterogeneity opens up new regions in niche space, facilitating colonization by new species. However, as heterogeneity continues to increase, each species has fewer habitat patches to utilize, population sizes decrease, and local extinction risk increases due to demographic stochasticity.
To explore this idea theoretically, Allouche et al. (2012) developed an individually based model using a continuous time Markov process. The details of their modeling approach can be found in the supplement to their article, which I recommend. In this post, I’ll demonstrate how to implement a discrete time version of their model in R. Thanks to the agent-based modeling working group at the University of Colorado for providing motivation to code up model in R.
Model structure
This model is spatially implicit, with \(A\) equally connected sites. Each site falls on an environmental condition axis, receiving some value \(E\) that characterizes local conditions. The environmental conditions for each site are uniformly distributed between two values that dictate the range of environmental conditions in a focal area. The local range of environmental conditions is a subset of some global range. There are \(N\) species in the regional pool that can colonize habitat patches. Each species has some environmental optimum \(\mu_i\), and some niche width \(\sigma_i\), which together define a Gaussian function for the probability of establishment given a colonization attempt and a habitat patch environmental condition \(E\).
It is assumed that all individuals that occupy a patch have the same per-timestep probabilities of death and reproduction. If an individual reproduces, the number of offspring it produces is a Poisson distributed random variable, and each individual offspring attempts to colonize one randomly selected site. At each time-step, every site has an equal probability of a colonization attempt by an individual from each species in the regional pool. Every habitat patch holds only one individual.
Offspring and immigrants from the regional pool do not displace individuals from habitat patches when they attempt to colonize. In empty sites, offspring receive colonization priority, with regional colonization occurring after breeding. When multiple offspring or immigrants from the regional pool could establish in an empty site, one successful individual is randomly chosen to establish regardless of species identity.
Parameters
The following parameters are supplied to the function alloucheIBM():
A = number of sites; N = number of species in the regional pool;
ERmin = global environmental conditions minimum; ERmax = global
environmental conditions maximum; Emin = local environmental minimum;
Emax = local environmental maximum; sig = niche width standard deviation for
all species; pM = per timestep probability of mortality; pR = per timestep
probability of reproduction; R = per capita expected number of offspring; and
I = per timestep probability of attempted colonization by an immigrant from
the regional pool for each patch.
Implementation in R
The function alloucheIBM() does the majority of work for this model:
The function returns a list containing a vector of species richness at each timestep, the proportion of sites occupied at each timestep, a state array containing all occupancy information for each patch, species, and timestep, and lastly a dataframe containing information on the niches of each species in the regional pool.
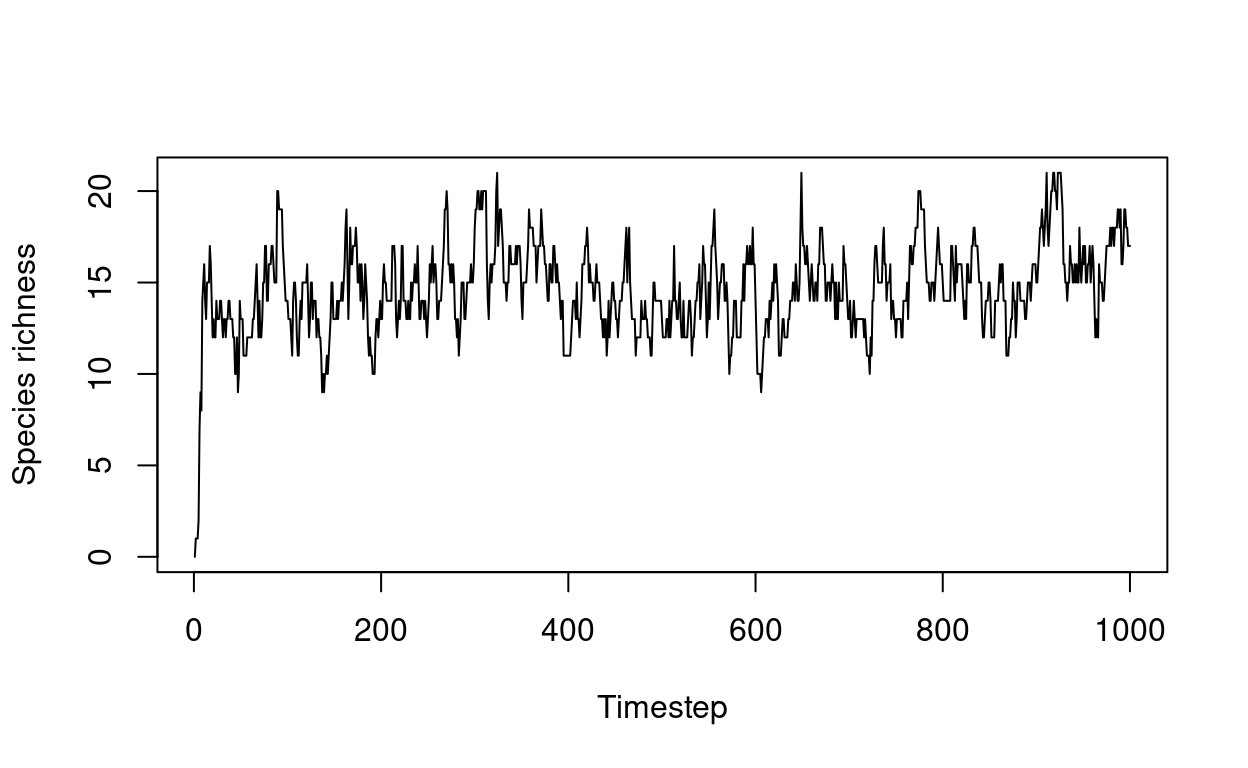
Using this function we can simulate richness through time:
Finally, we can address the issue of habitat heterogeneity and its effect on species richness. There are many ways to approach this issue, and many parameter combinations to consider. Allouche et al. (2012) provides a thorough treatment of the subject; I’ll demonstrate just one result: that under certain conditions, species richness peaks at intermediate levels of habitat heterogeneity.
To construct a range of habitat heterogeneity values, let’s construct an interval and take subsequently narrower intervals centered around the middle of the original interval.
Now, for each interval, we can iteratively run the model and track species richness. Because species richness tends to vary through time, let’s take the mean of the final 100 timesteps as a measure of species richness for each model run, and record the standard deviation to track variability.
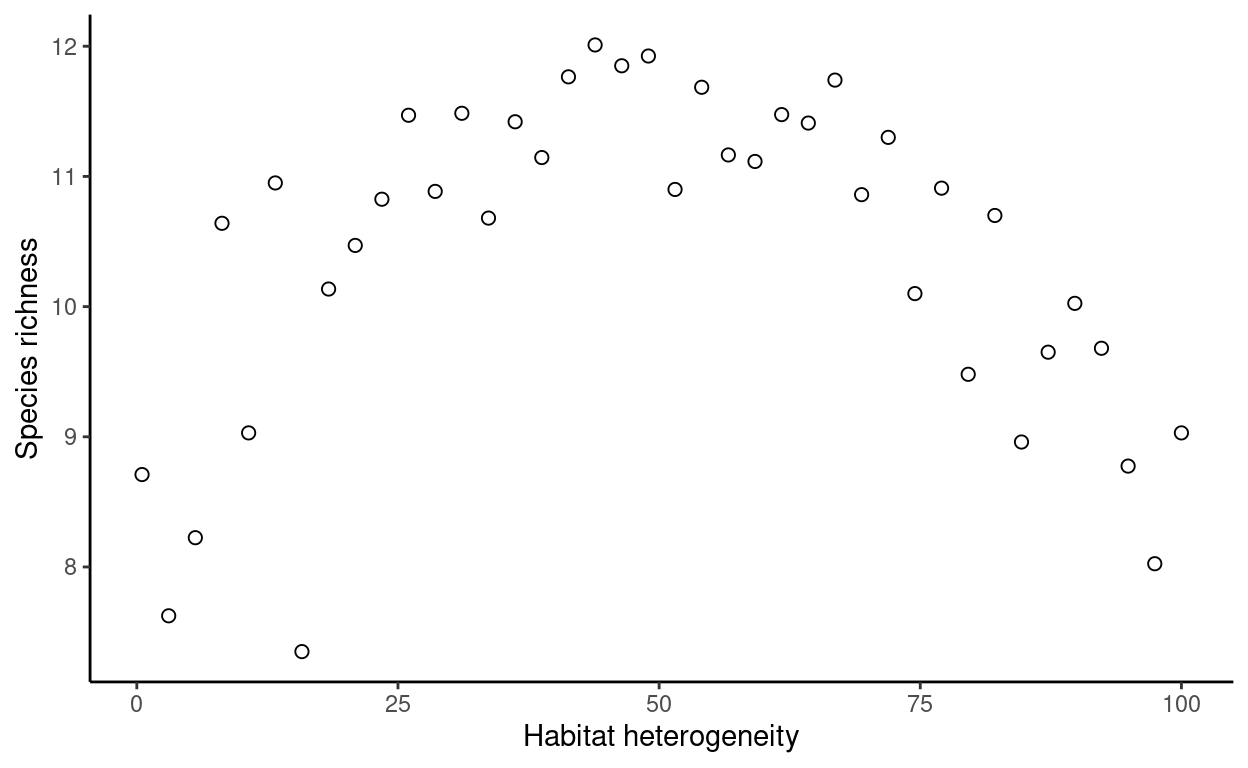
Of course, the shape of this relationship is sensitive to the parameters. As an example, changing niche width to increase or decrease niche overlap will mediate the strength of interspecific competition for space. Also, increasing reproductive rates may buffer each species from stochastic extinction so that the relationship between environmental heterogeneity and richness is monotonically increasing. Furthermore, here I centered all intervals around the same value, but the exact position of the environmental heterogeneity interval will affect the net establishment probability for each site, depending on how the interval relates to species niches. The parameter space is yours to explore.
These types of stochastic simulation models are fairly straightforward to implement in R. Indeed there’s a package dedicated to facilitating the implementation of such models: simecol. There’s even a book (Soetaert and Herman 2008).