I do a lot of scholarly writing that requires associated or embedded R analyses, figures, and tables, plus bibliographies.
Microsoft Word makes this unnecessarily difficult.
Many tools are now available to break free from
the tyranny of Word.
The ones I like involve writing an article in
markdown format, integrating all
data preparation, analysis, and outputs with the document (e.g. with the
excellent and accessible knitr package or with a
custom make set up
like this one).
Add in version control with Git, and you’ve got a nice
stew going.
If you’re involved in the open source/reproducible research blogo-twittersphere, this is probably old hat. To many others, it’s not.
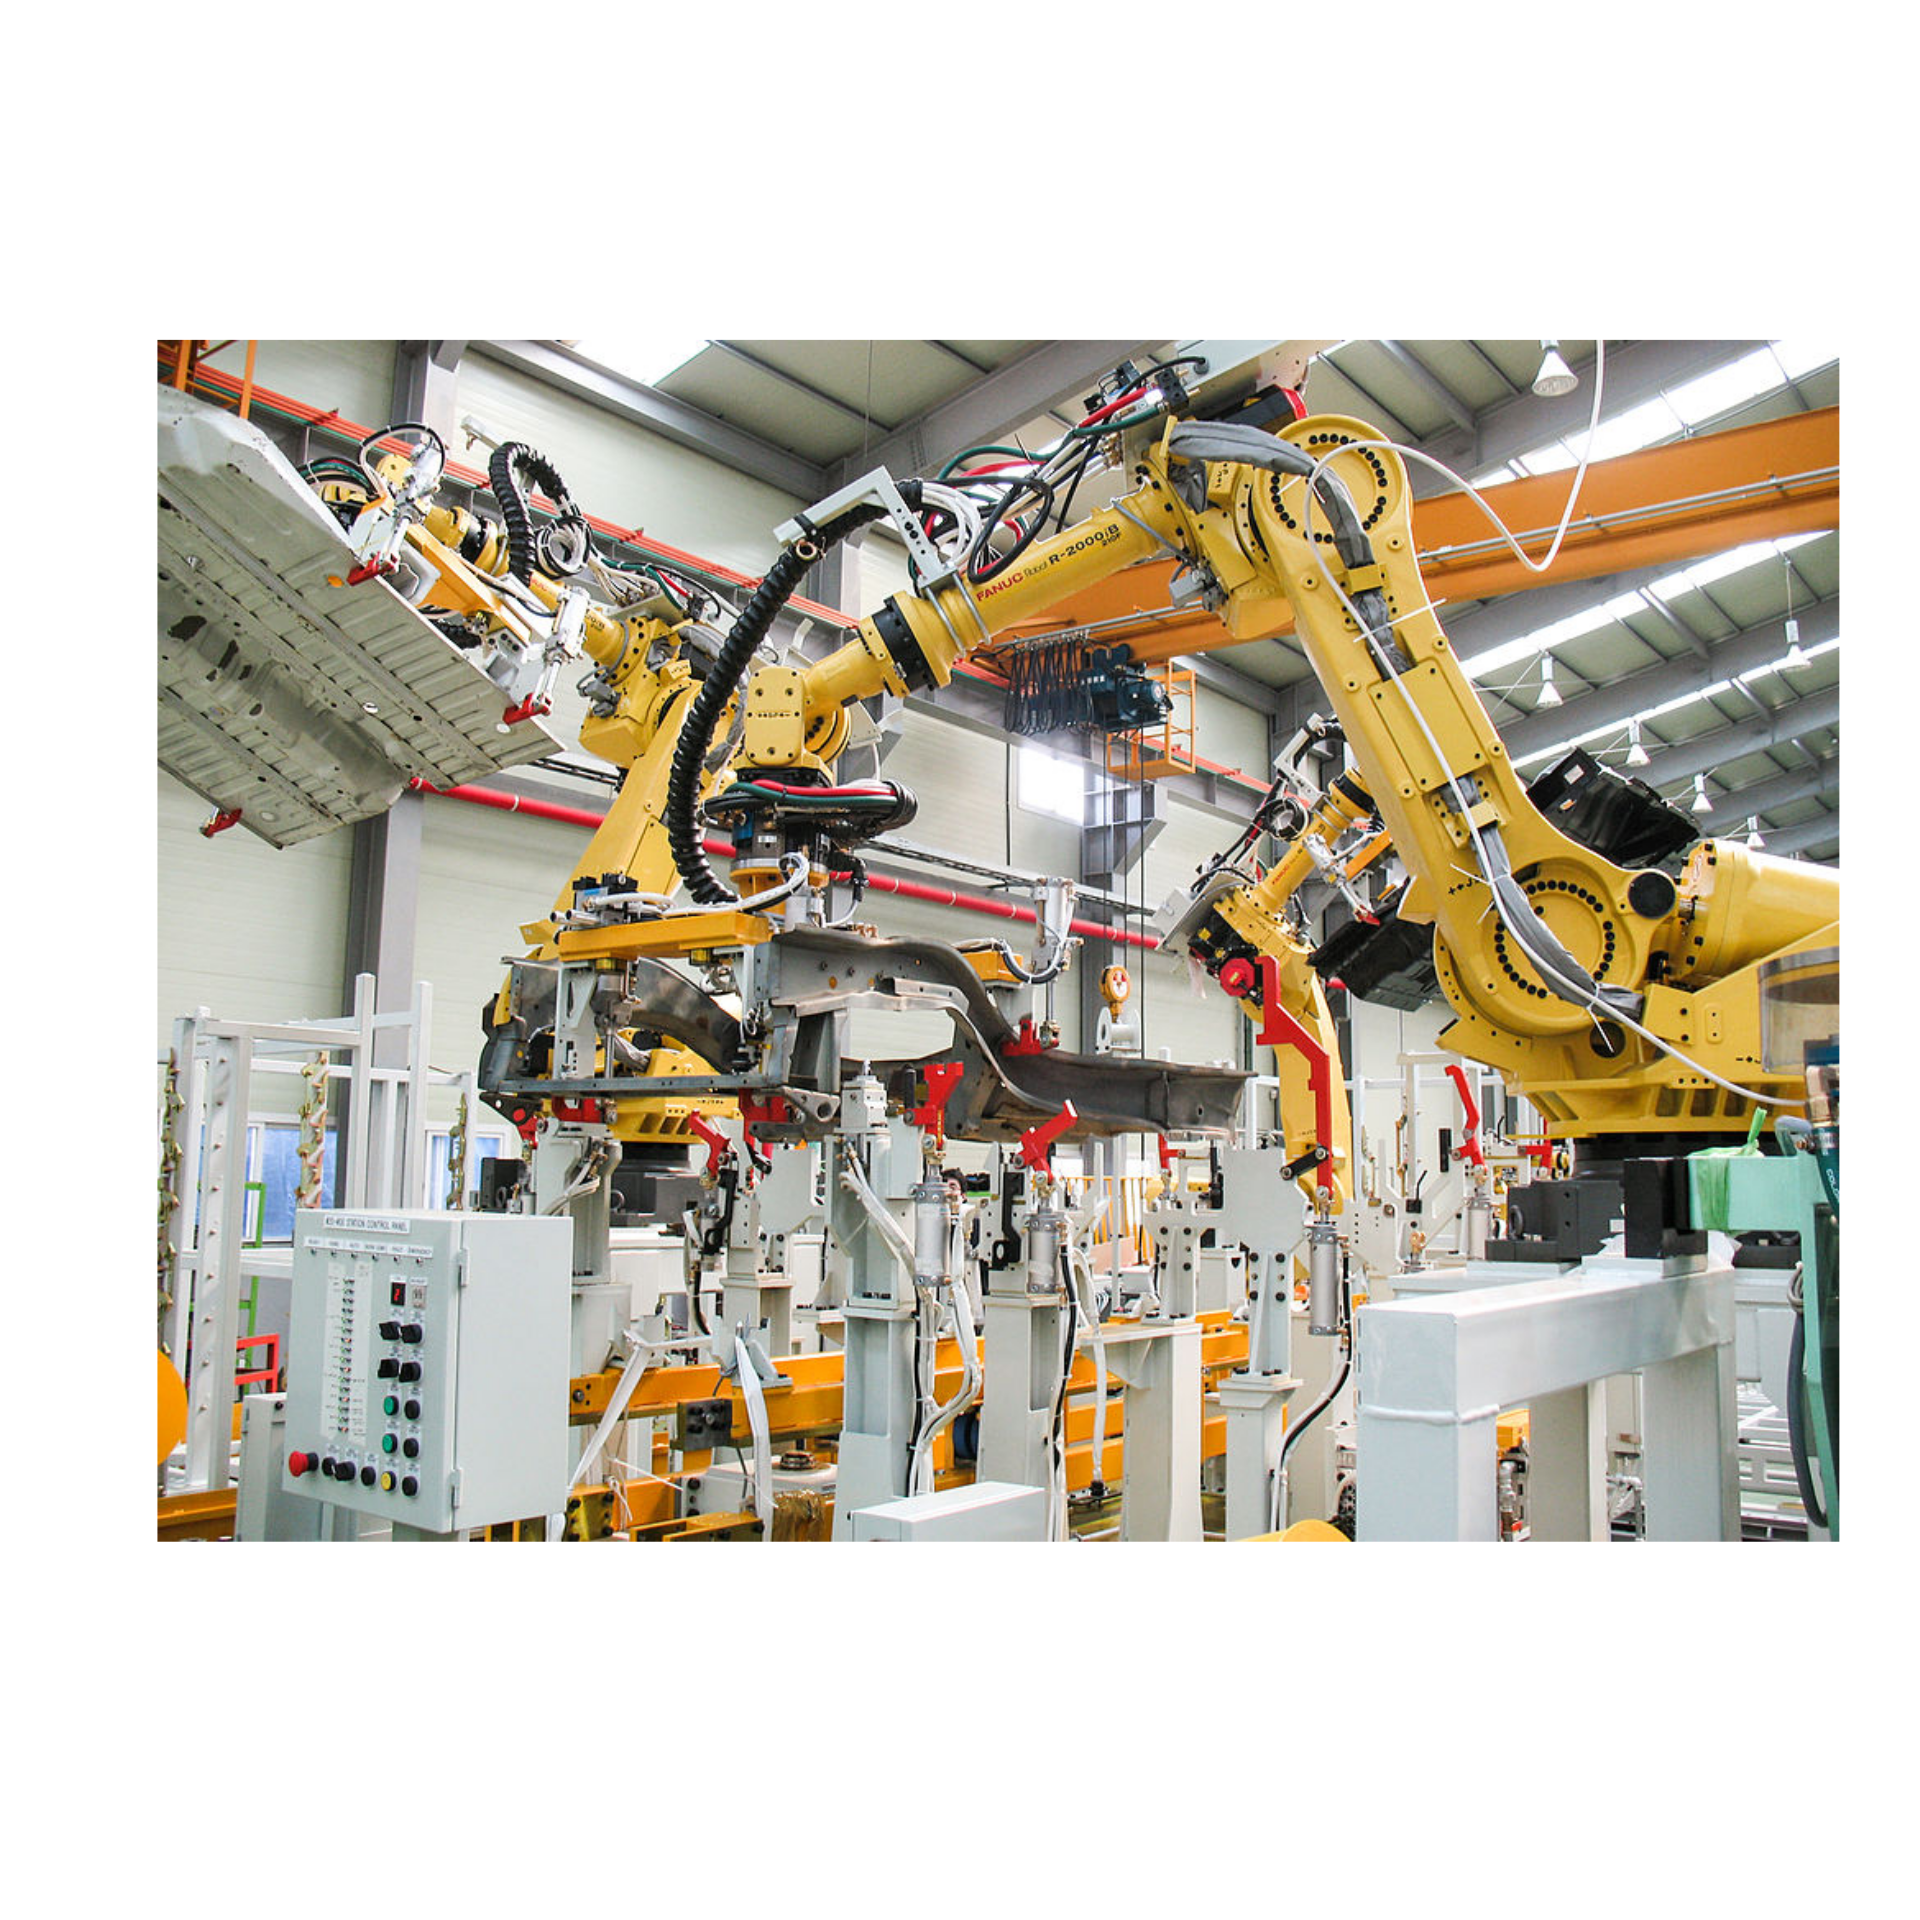
Most scientists I see in the wild still manually insert figures and results from statistical analyses in Word documents, perhaps the manufacturing equivalent of hand-crafting each document. R markdown provides a level of automation that is amenable to creating many documents or recreating/updating one document many times, the manufacturing equivalent of automated robots that increase efficiency (but do require some programming to function properly).
I can’t give an authoritative overview, but here are some resources that helped me get through my divorce with Microsoft Word:
- R Markdown = knitr + RStudio may be one of the better places to start
- How to ditch Word by Karthik Ram
- Markdown and the future of collaborative manuscript writing by Karthik Ram
- Git can facilitate greater reproducibility and increased transparency in science (Ram 2013)
- What is scholarly markdown? by Martin Fenner
- Markdown for scientific writing
- Pandoc to convert from markdown to almost any other format
- pandoc-citeproc for citations
- Citations in markdown using knitr for another take on citations, from Carl Boettiger
- Getting started with make