The R package spdep
has great utilities to define spatial neighbors (e.g. dnearneigh,
knearneigh, with a nice
vignette to
boot), but the plotting functionality is aimed at base graphics.
So, to save others some trouble, I thought I’d share a little snippet to
convert a spatial neighbors object (of class nb) to an sf data frame.
library(sf)
library(spdep)
library(ggplot2)
fname <- system.file("shape/nc.shp", package="sf")
nc <- st_read(fname, quiet = TRUE)
nc_sp <- as(nc, 'Spatial')
neighbors <- poly2nb(nc_sp)
neighbors_sf <- as(nb2lines(neighbors, coords = coordinates(nc_sp)), 'sf')
neighbors_sf <- st_set_crs(neighbors_sf, st_crs(nc))
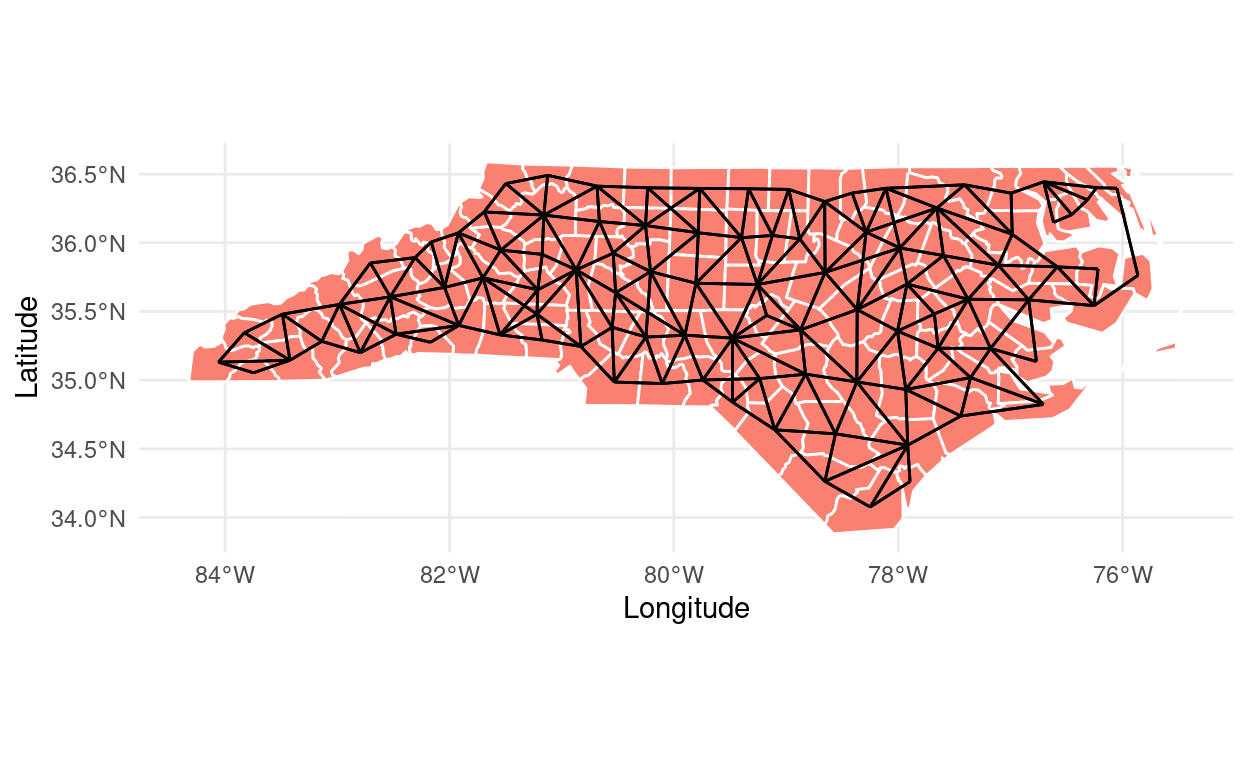
ggplot(nc) +
geom_sf(fill = 'salmon', color = 'white') +
geom_sf(data = neighbors_sf) +
theme_minimal() +
ylab("Latitude") +
xlab("Longitude")